The CII Illusion: Why Annual Ratings Lie
by Matthew Galston, CEO OceanPass
Each January, the shipping industry receives its verdict. The IMO’s Carbon Intensity Indicator (CII) ratings are published, categorizing vessels from A to E based on their emissions performance over the previous year. For some stakeholders—bankers, charterers, owners - these grades carry serious weight. A C-rated ship might struggle to find premium charters; a D or E could trigger costly penalties or financing challenges.
The problem? Those ratings, while precise on paper, can be profoundly misleading.
The Missing Context
CII is calculated using an annual average of emissions per transport work. But in practice, the number obscures the “why” behind a vessel’s performance. Is the ship performing poorly due to technical inefficiencies? Or because it spent 15 days idling outside a congested port or dry-docking instead of gaining 15 additional days of transport work? Did a spike in speed to meet a contractual window erase months of careful slow steaming?
Without this operational context, annual CII ratings can punish good ships for bad circumstances - or worse, reward inefficient ones that happened to operate in optimal conditions.
Why This Matters?
For banks, a misleading rating could distort a portfolio’s climate alignment score under the Poseidon Principles, affecting both disclosures and lending strategies.
For charterers, it could mean avoiding a vessel that’s perfectly capable of meeting contractual CII thresholds.
For owners, it can damage commercial credibility and financing terms, even if the root cause of the downgrade was temporary or unavoidable.
Annual ratings offer no room to explain the nuance, no visibility into whether performance is a trend or an anomaly. Decisions are made on a blunt metric.
Seeing the Signals Before the Score
This is where operational intelligence changes the game. By analyzing factors such as average and maximum speed, time at anchor, ballast-to-laden ratios, and weather impacts, it’s possible to diagnose the drivers of performance before the final rating is locked in.
Take speed, for example. A modest 0.5 knots increase in speed can drive a 12% rise in fuel burn due to the cubic relationship between speed and resistance. Combine that with an early arrival that forces days of idle time, and a compliant vessel can slip a rating band without a single technical fault.
With near-real-time monitoring, those trends can be spotted and addressed mid-year - slowing down on certain legs, adjusting arrival times, or altering routing - so that operational corrections prevent a year-end downgrade.
From Compliance Metric to Strategic Tool
This isn’t about gaming the system. It’s about ensuring that CII ratings reflect operational reality, not statistical accident. For financiers, it means avoiding unnecessary misalignment penalties. For charterers, it enables more accurate vessel selection and contract planning. For owners, it safeguards both earnings and reputation.
Annual ratings are here to stay, but their interpretation - and the ability to act before they become final - will define competitive advantage in the decarbonisation era.
In the same way a credit score becomes far more useful when paired with spending history, CII ratings gain real value when paired with operational insight. Without that context, they are just numbers. With it, they become a map. And in shipping’s transition to net zero, knowing the route is everything.

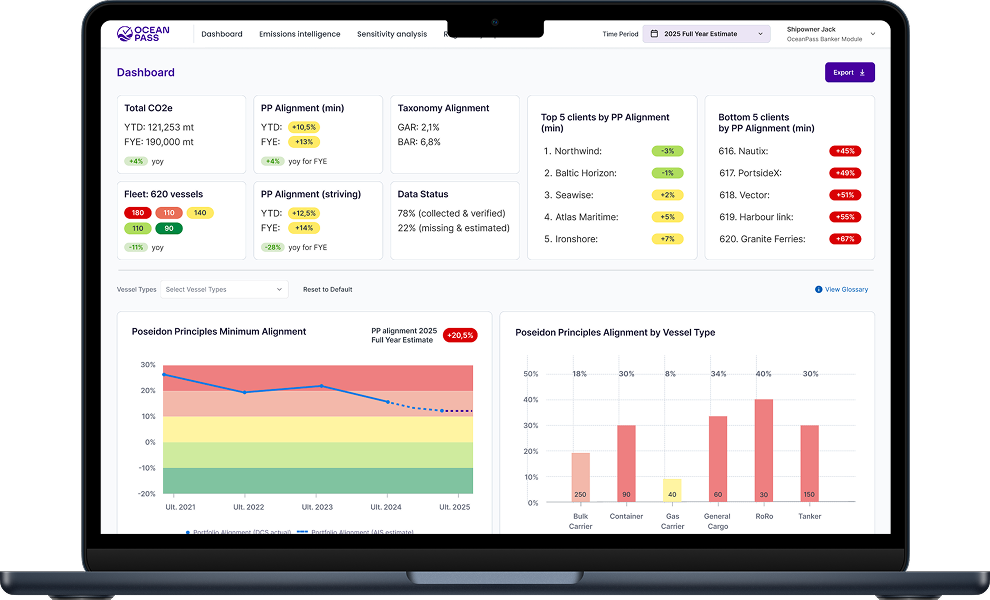
Introducing the OceanPass Bankers Module
For Poseidon Principles-aligned banks, the OceanPass Bankers Module dramatically simplifies the complexity of annual data gathering and reporting—while laying the groundwork for a more dynamic, insight-driven approach to ship finance.
Streamlined Annual Compliance:
Reduce the time, effort, and uncertainty involved in collecting emissions data from clients each year. The Bankers Module transforms the end-of-year scramble into an organized, automated process that produces disclosure-ready reports in the Poseidon Principles format.
Pathway to Real-Time Transparency:
As more shipowners join the OceanPass platform to streamline their own reporting, banks gain access to validated performance data during the reporting year—not just after the fact. This positions financiers to take timely portfolio actions rather than reacting post-disclosure.
Onboard Crew Module Integration:
For ESG-linked loans, performance tracking can be elevated to a new standard. With the onboard module in place, both banks and their clients gain continuous visibility into the key metrics that could influence loan terms up or down.
Quarterly Data Option—No Onboard Installation Required:
Even without onboard hardware, banks can request that clients share emissions data quarterly via the standard DCS template. OceanPass can instantly validate this data and generate portfolio-level insights to guide mid-year decision-making.
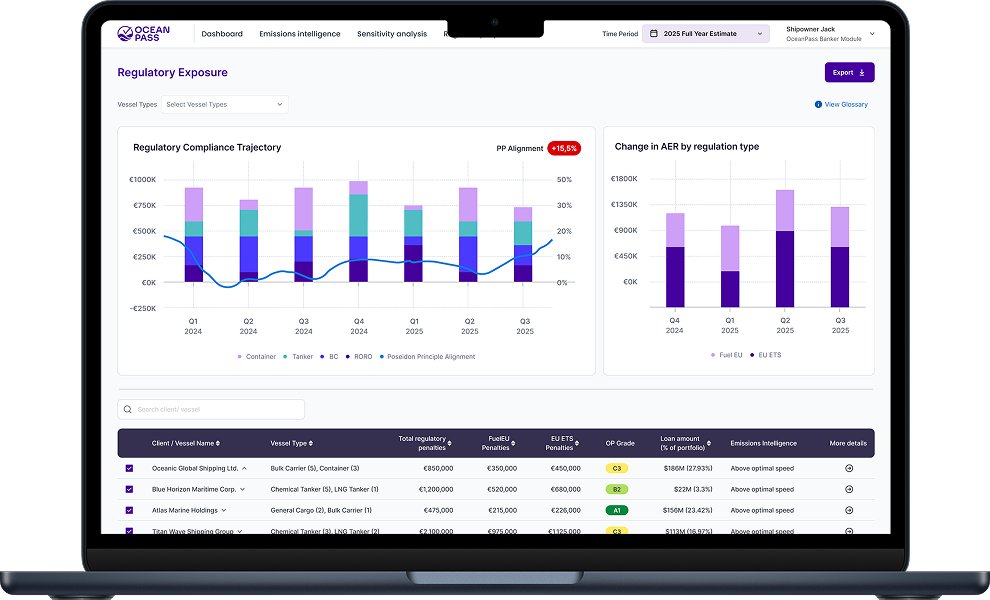
Portfolio Performance Intelligence:
Instantly view overall portfolio alignment, identify top and poor performers at the vessel or client level, and understand the contribution of each vessel, client, or ship type to total climate alignment scores.
Infrastructure for Green Capital Deployment:
OceanPass is more than a compliance tool. By creating trusted, timely performance transparency, we are building the infrastructure that enables financial institutions to confidently scale ESG-linked lending and green capital products.
The Architect’s Log
Each month, OceanPass Chief Innovation Officer Michael Schmidt — naval architect, vessel designer, and member of the Sea Cargo Charter’s technical steering committee — shares a note from his desk. Blending technical precision with commercial insight, Michael reveals the signals shaping shipping’s decarbonisation journey and the innovations that can turn compliance into competitive advantage.
The Fuel Type Trap
In shipping, small reporting errors can have big consequences. One of the most common — and costly — mistakes I see is the misclassification of fuel type in IMO DCS reports.
The IMO DCS form has three fossil fuel oil categories: MGO/MDO (distillates), LFO, and HFO (both residual fuels). The critical detail? The LFO vs. HFO distinction is based on viscosity, not sulfur content. Onboard, crews naturally think in terms of very low sulfur vs. high sulfur fuels, because that’s how they buy and burn fuel. But when those terms get translated into DCS categories, the link to viscosity is often missed.
Default emission factors for IMO DCS based data
| Fuel Type | Emission factor (WtW gCO2e/gfuel) | Source |
|---|---|---|
Not all fuels are created equal — and neither are their categories. IMO DCS classifies LFO and HFO by viscosity, not sulfur. Get it wrong, and you could be overstating emissions and misjudging CII performance. Accuracy starts with knowing the difference.
The result: low sulfur fuels that should be reported as HFO (due to viscosity) end up logged as LFO. That might sound harmless — after all, isn’t LFO “cleaner”? — but under CO₂e accounting, it can actually penalize you. Distillates and light fuels carry higher upstream emissions from refining. Report LFO where it should be HFO, and you’re overstating your footprint. Over time, that can push a vessel’s CII rating down and erode compliance margins.
At OceanPass, we solve this by validating at the source. We collect Bunker Delivery Notes (BDNs) for every vessel. BDNs verify not just what was burned, but what was physically on board. They cut through the ambiguity of crew-reported categories and let us map fuels correctly across IMO, Poseidon Principles, and Sea Cargo Charter methodologies — each with their own factors and quirks.
Regulations are only getting more granular. As CO₂e accounting expands, the margin for error shrinks. In this environment, accurate fuel categorization isn’t just a box-ticking exercise — it’s a competitive advantage. The details matter. And we make sure they’re right.
What that means for a vessel that actually burns residual fuel (HFO) but reports it as LFO, the extra CO₂e credited is seen in the chart below.
| Annual residual fuel actually burned (tonnes) | Extra CO2e if reported LFO (tonnes) |
|---|---|
Misclassify residual fuel (HFO) as LFO and you add ~5.7% CO₂e on paper. For a typical bulker burning ~5,000 t/yr, that’s ≈ 1,100 t CO₂e overstated—enough to move ratings and distort cost and WtW reporting increasingly takes effect.